Typical questions often arise in the context of customer portfolio management and exploitation: Which turnover can I expect with which customer? Which customer will generate how much turnover per product group? Which customers do not meet their sales expectations (underperformers) and should be approached with determination? Where do cross- and up-selling potentials arise?
Each sales employee is responsible for several hundred inventory addresses. However, he cannot intensively support all customers in the course of a year. In most cases, the salesperson therefore intuitively decides on the addresses of the customer base with which he has been able to build up a special relationship and with which he can easily generate sales. As a rule, these are also the strategically important customers. However, it would be uneconomical and often not even possible for capacity reasons to have the remaining customers processed by the sales department.
Evaluate with Customer Value Prediction performance
Dastani Consulting developed the Customer Value Prediction model as a solution approach to identify the most promising customers from the large pool of the masses and to recognize acquisition decisions as early as possible, so that the sales department is actively involved. In Customer Value Prediction (CVP), the entire customer base is evaluated with regard to the future performance of each individual customer and thus its importance for the company. The aim is to predict the future revenue, cross-selling and up-selling potential of each individual customer.
Evaluation of transaction data
The CVP is primarily based on the transactions stored in the ERP system and thus the company’s own data. The system learns independently based on several million transactions of the past years. Statistical formulas are derived from this data to determine whether a customer from a certain product group will buy within a defined period of time (e.g. within the next 12 months) and in what amount of sales he will be active.
Customer-specific expected values
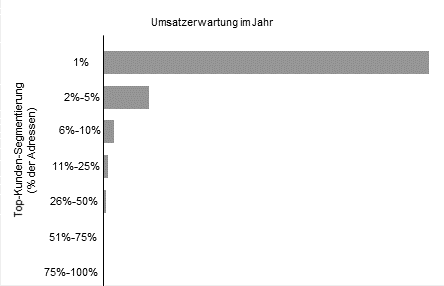
As a result, the customer values per customer and product area are output for a previously defined period of time. The following figure 1 illustrates the degree of segmentation in a respective product area, which is very striking. For marketing and sales activities, only the first 10% of customer addresses are usually of interest.
For an example customer, the sales expectations can be broken down by product area. Adding up all product groups results in the total sales forecast of the customer. It indicates the customer’s value contribution to the future development of the company.

Benefits of the forecast
The CVP can be used in a variety of ways as the basis for centrally controlled communication. In the so-called needs analysis, customers can be addressed with the most relevant products. On the other hand, the customers with the highest affinity for a certain product can also be selected. In this way, certain product areas can be promoted, sales campaigns can be addressed and year-end business can be boosted.
Application for sales allocation
In principle, other possible applications are conceivable: Customer value prognoses make it possible to address customers specifically according to their preferences. The analysis identifies the customers in the C segment that have the potential to become A and B customers and can be suggested to sales for more intensive processing (Figure 2). Conversely, however, it is also possible to identify which customers should no longer be closely monitored by sales. The segmentation of customers into A-B-C customers can be corrected on the basis of the analyses (Figure 3).

If you have any further questions, please visit our social media channels (Xing, Linkedin, Instagram) call us at +49 (0)641 984 46 – 0.
